Knowledge Graphs for eGovernment & Smart Cities
September 20th, 2018
Wouter Beek (w.g.j.beek@vu.nl, wouter@triply.cc)
Knowledge Graphs
Knowledge Graphs:
The Network Effect for Data
What's the Network Effect?
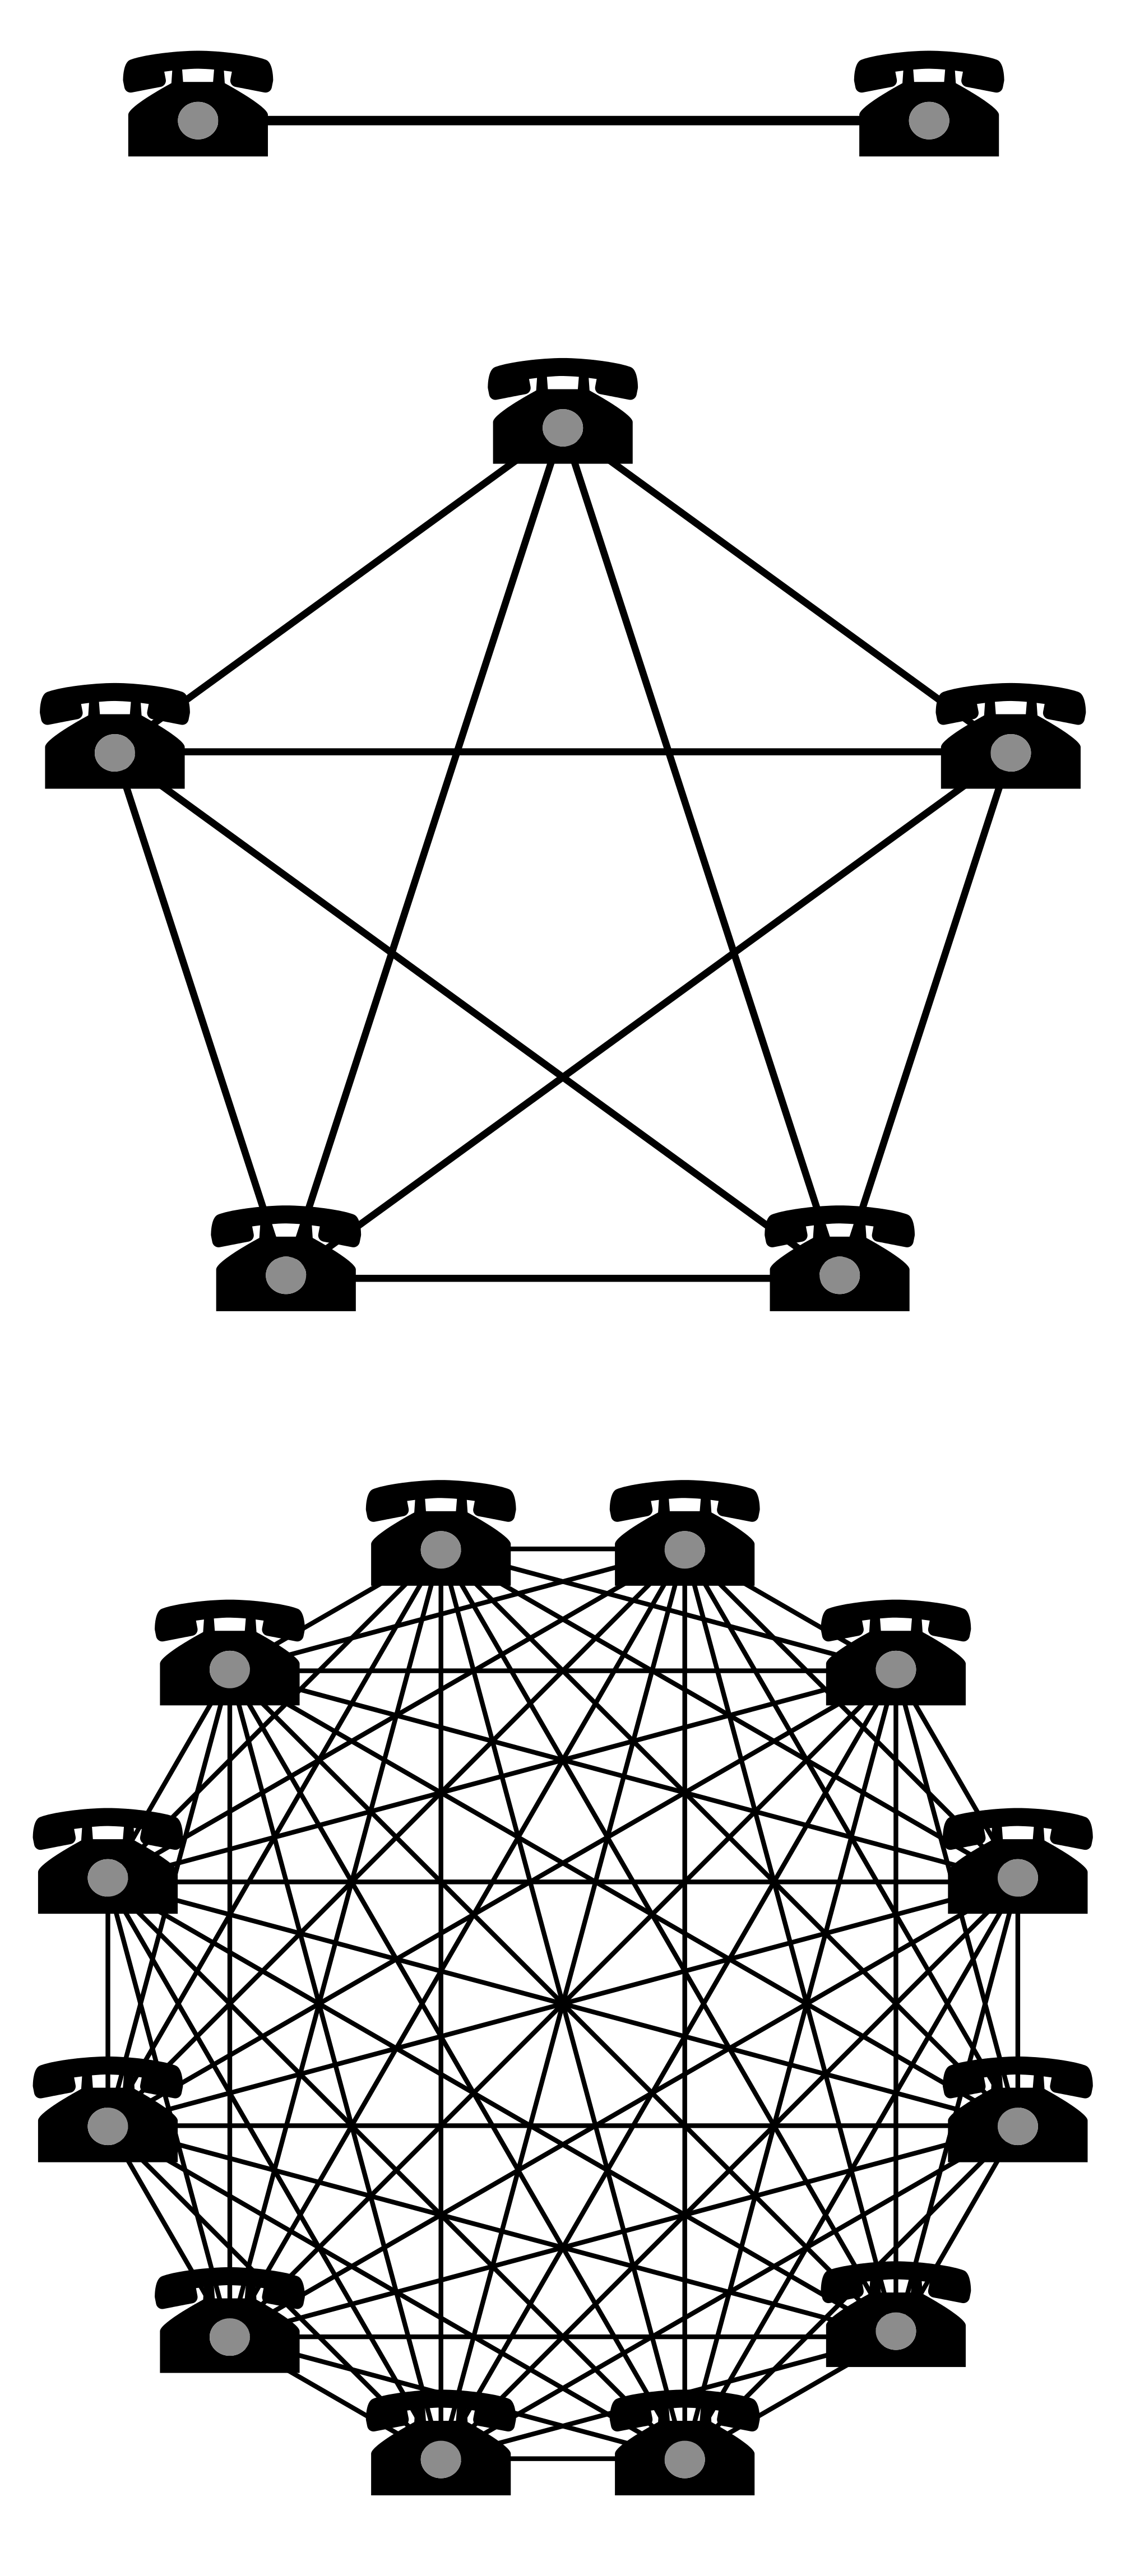
The value of a network is proportional to the square of the number of connected nodes.
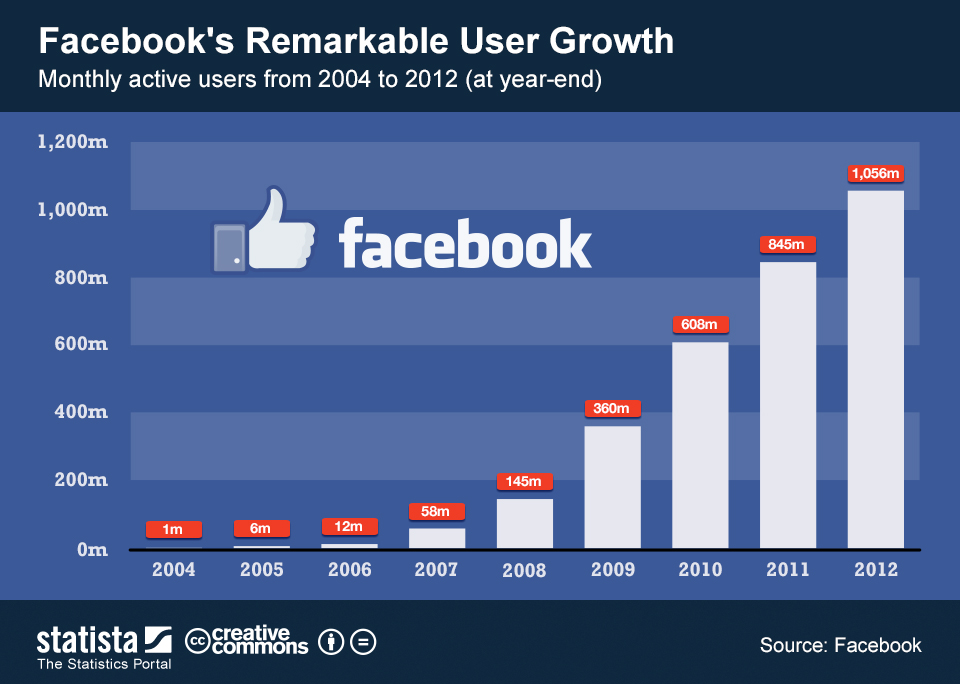
Exponential growth

Exponential growth
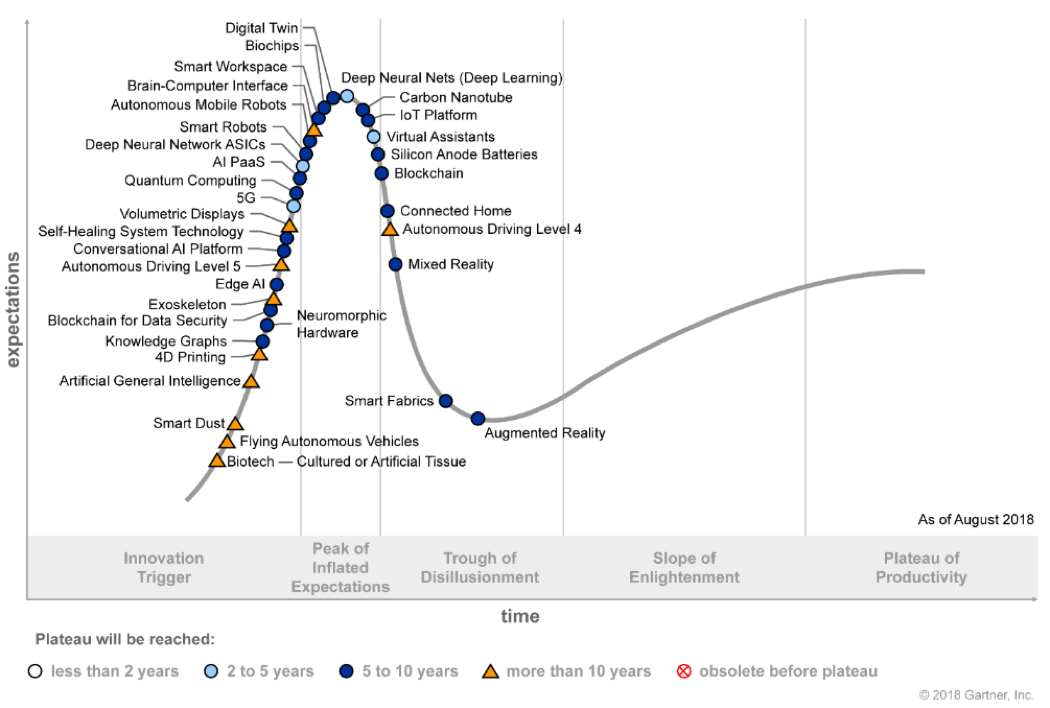
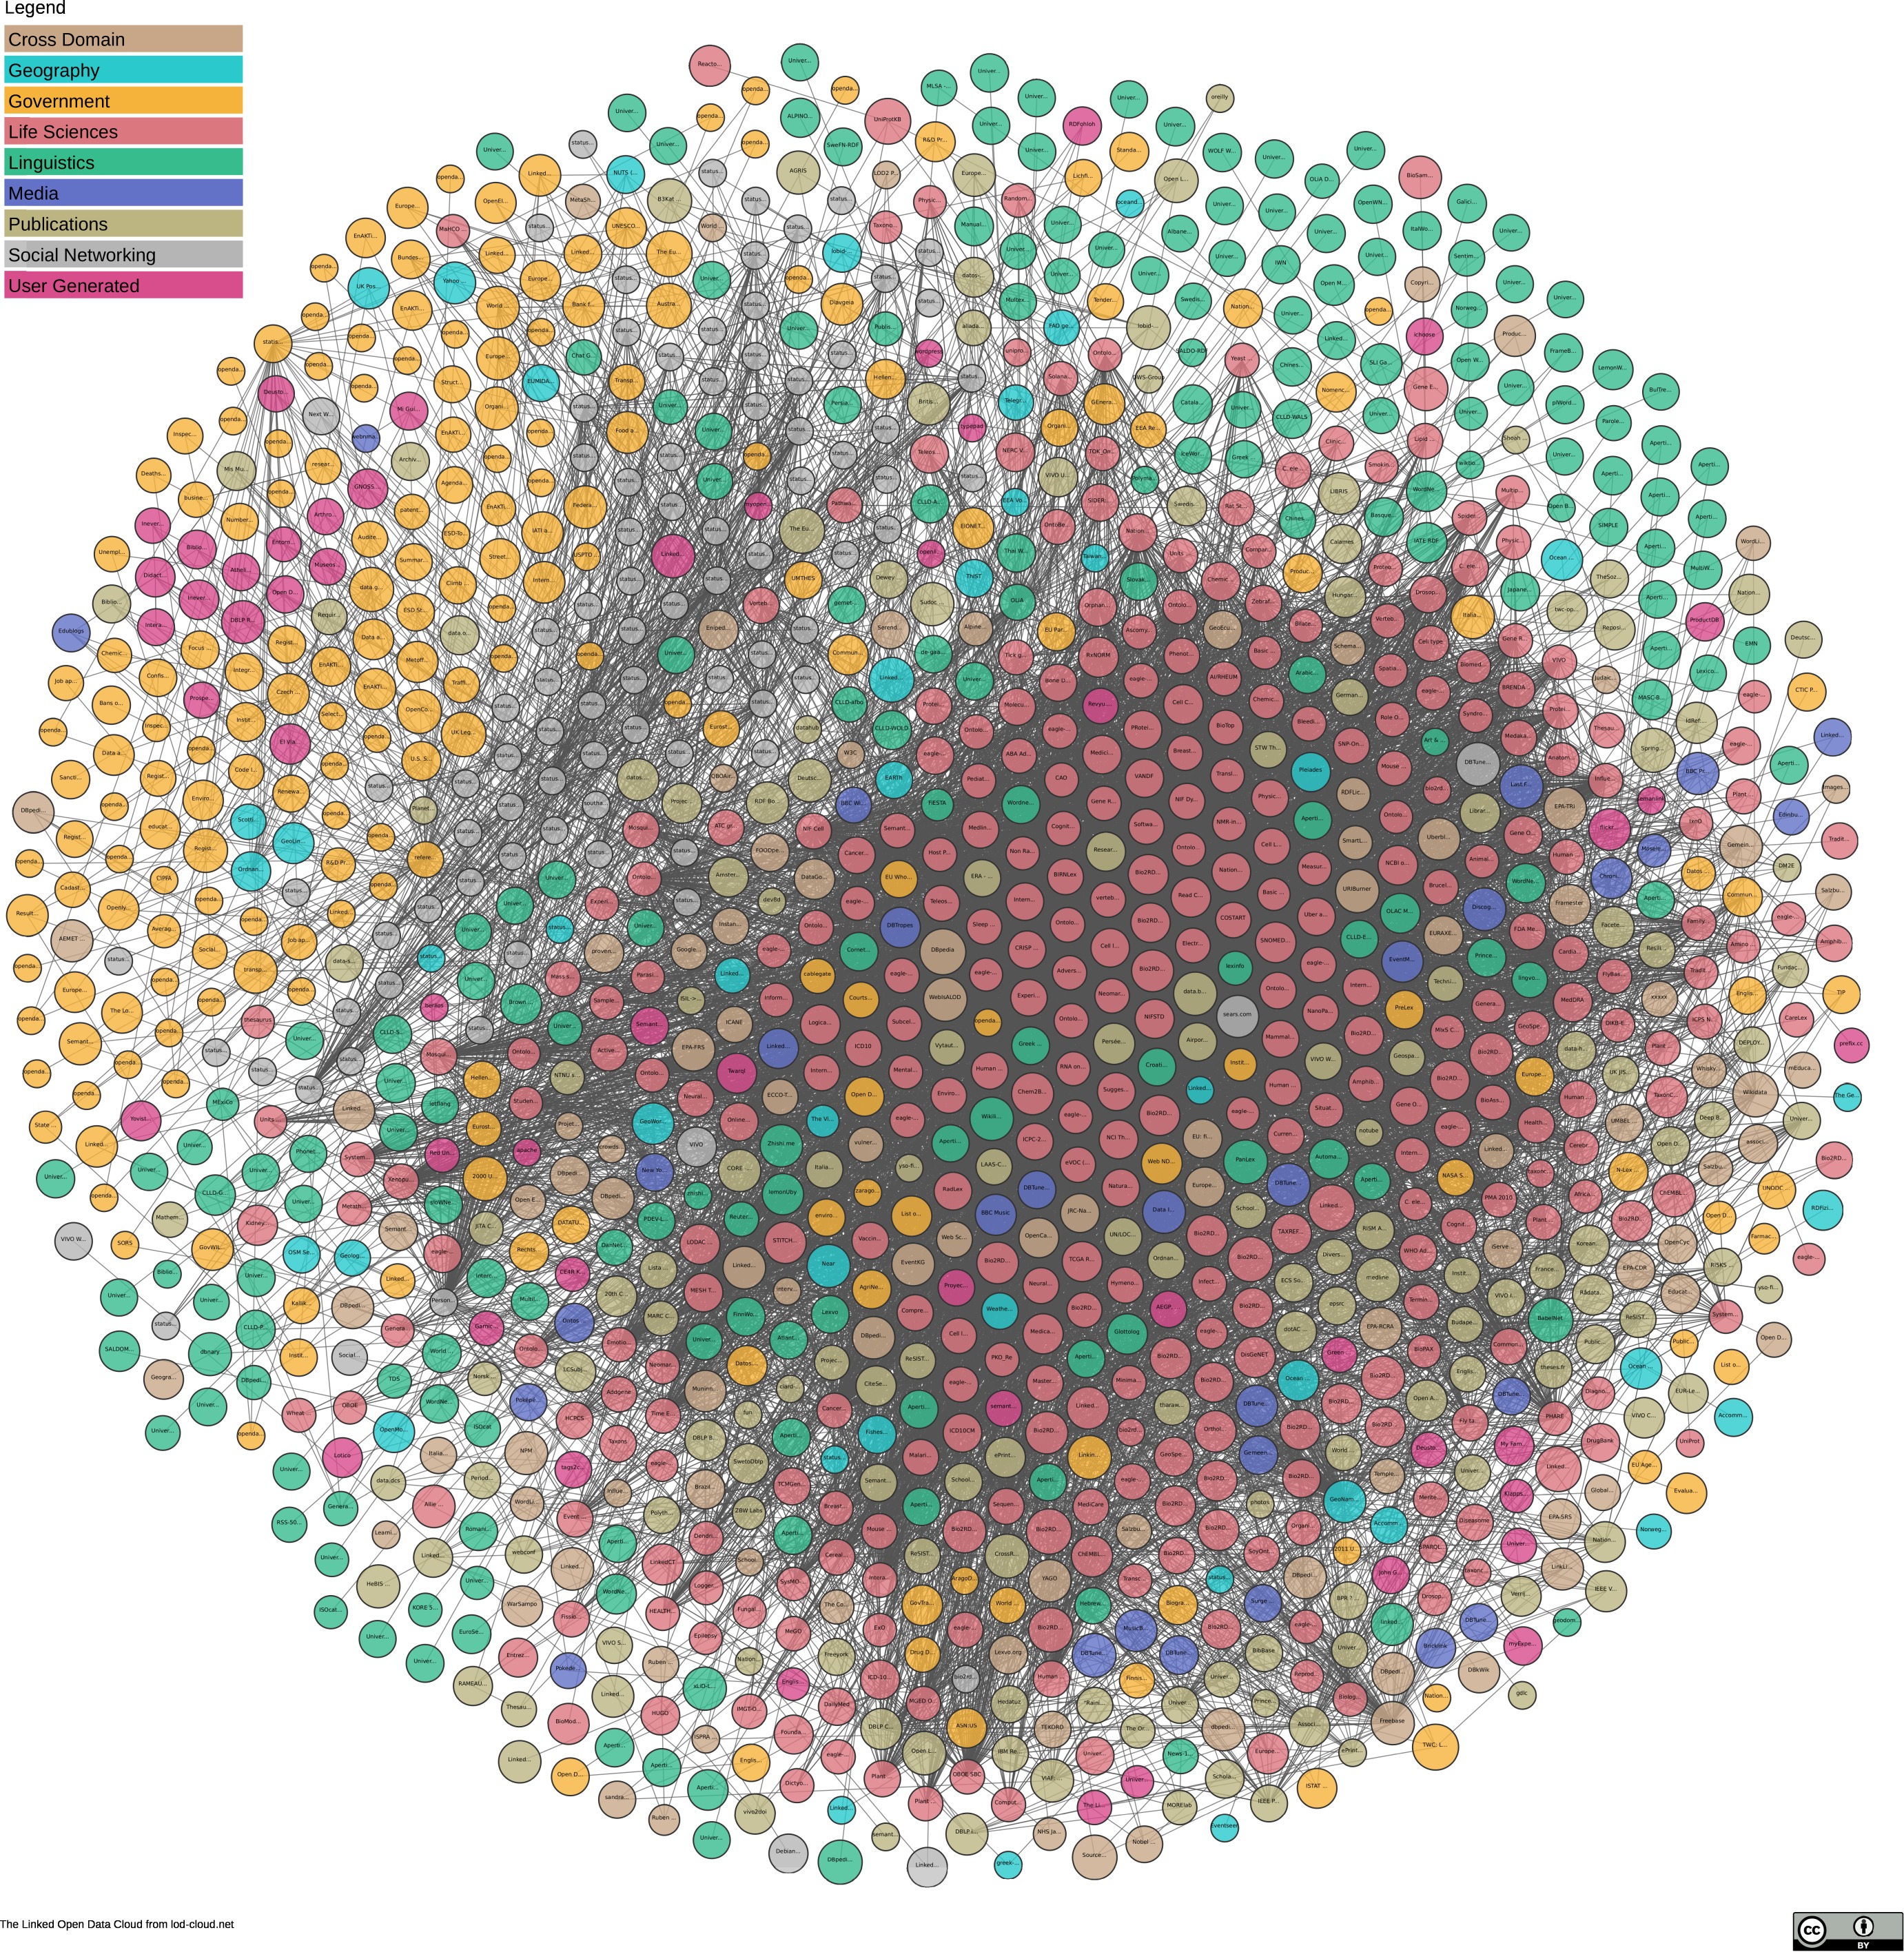
How Big is the Open Knowledge Graph?
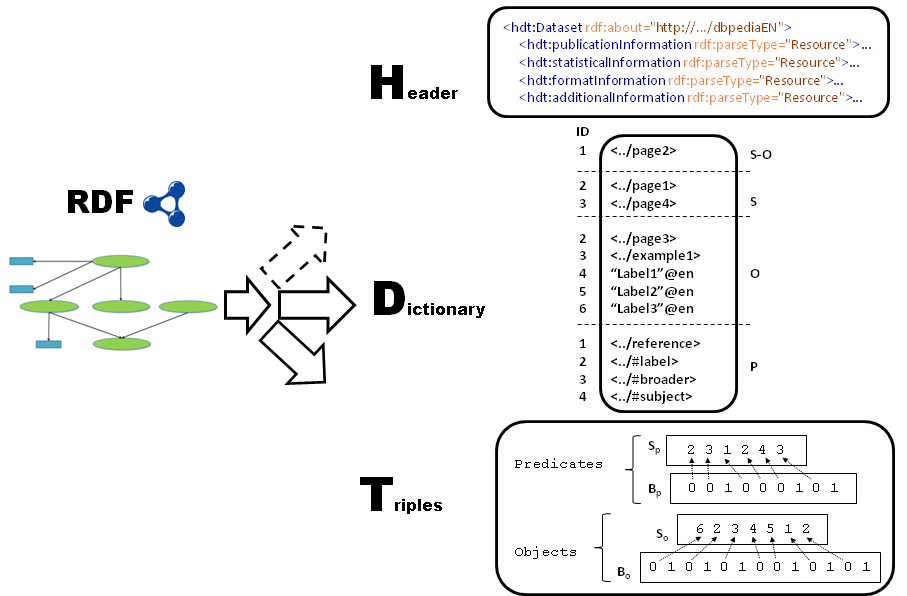
Store Large Knowledge Graphs
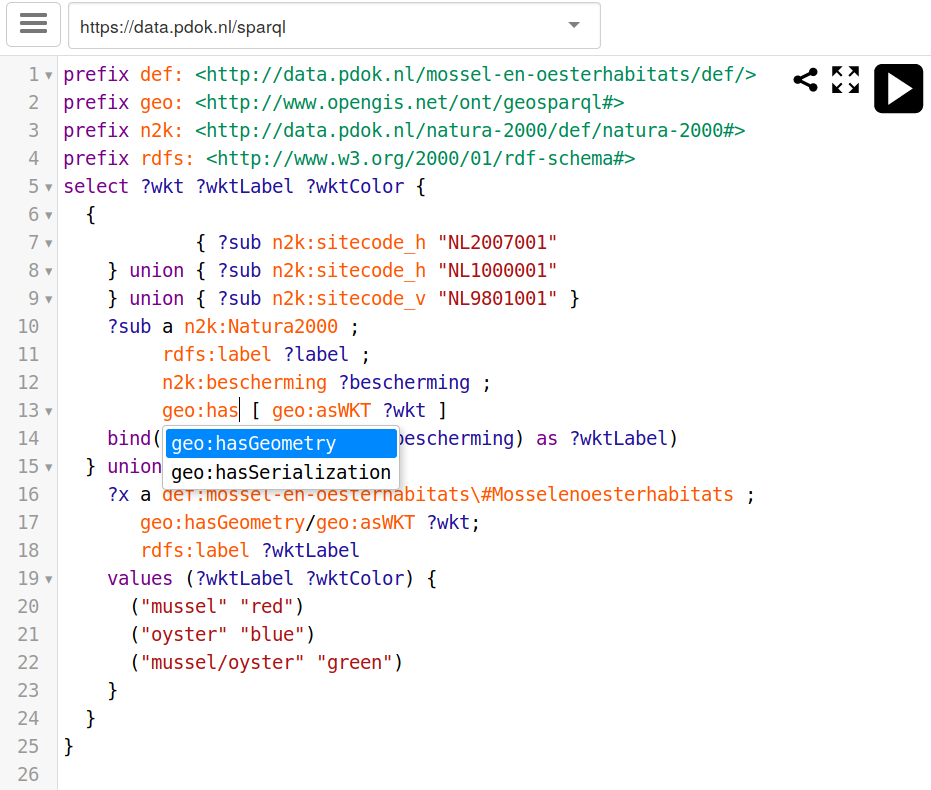
Use Large Knowledge Graphs (IDE)
How Big are Corporate Knowledge Graphs?


Combining Governmental Datasets
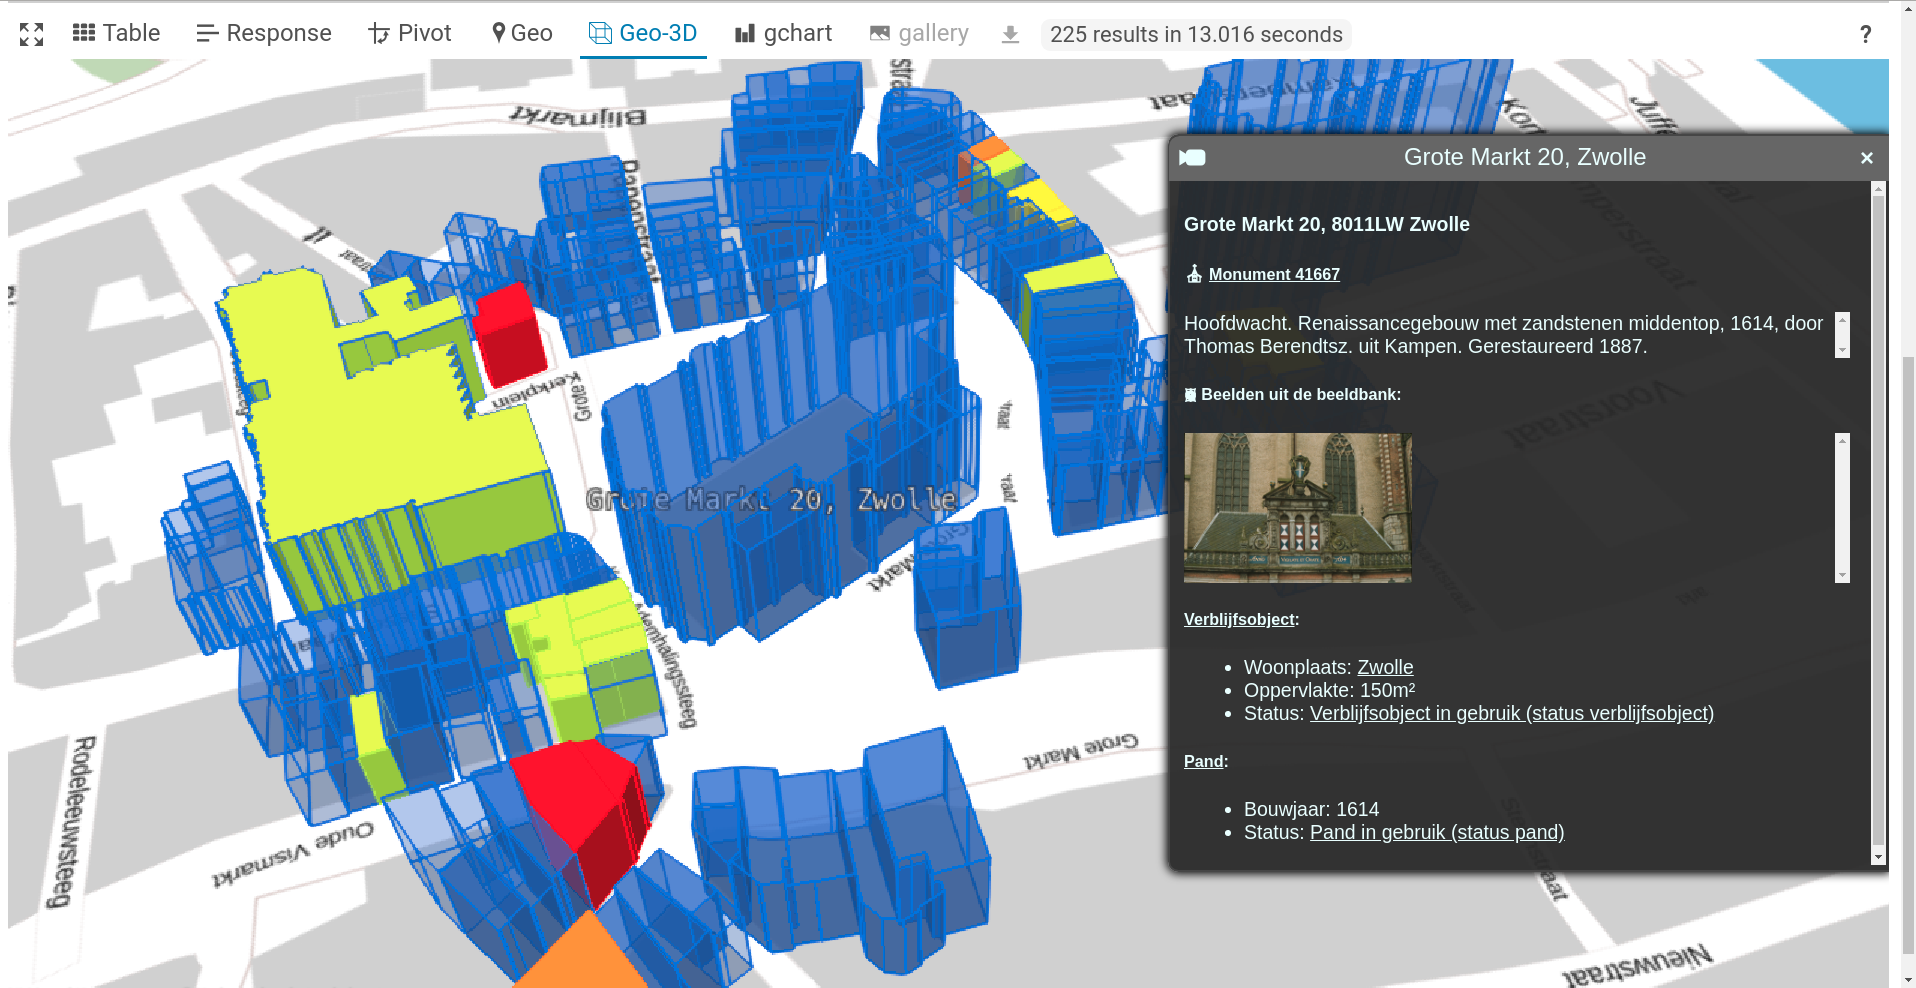
Querying across datasets & institutions:
- Cadastre
- Base registries
- Chamber of Commerce (KvK)
- Company registrations
- Cultural Heritage Agency (RCE)
- Monument registry
- Netherlands Enterprise Agency (RVO)
- Energy labels
Example: De Boelelaan
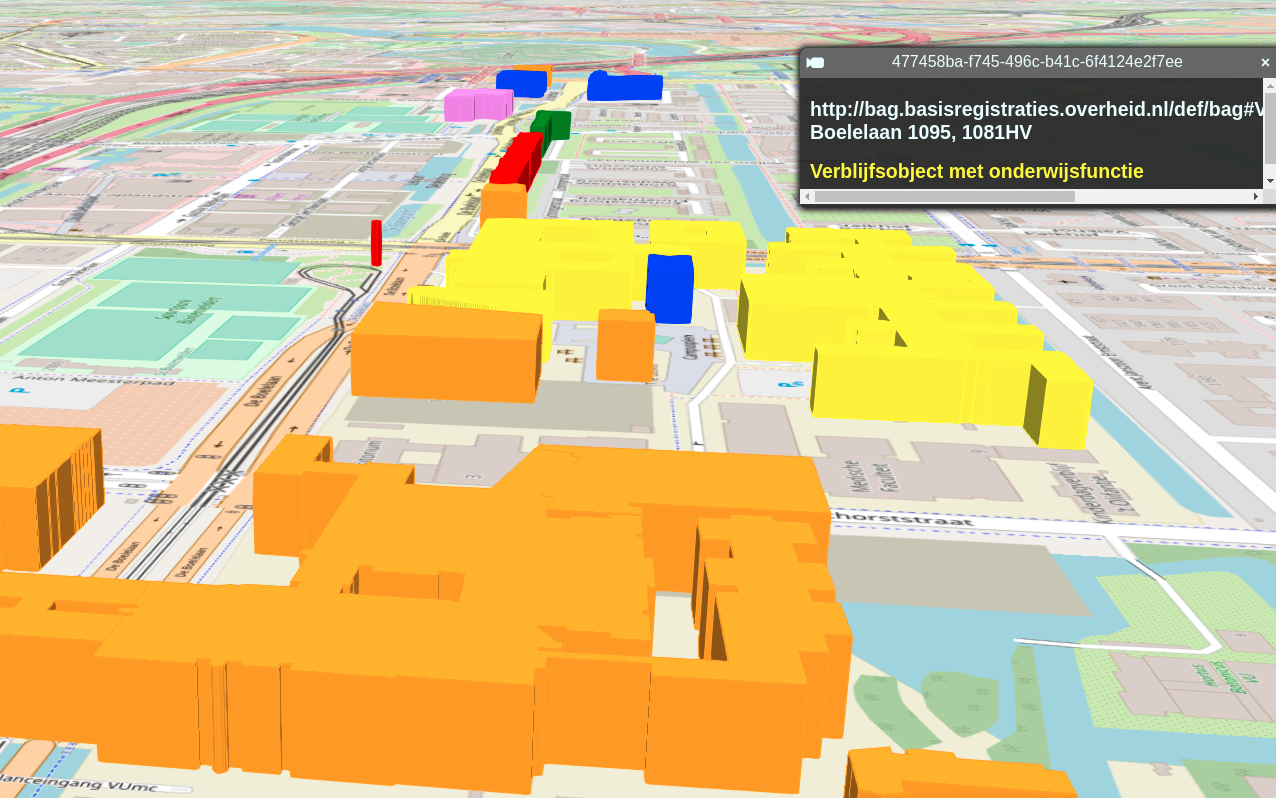
- Living space
- Shopping
- Offices
- Education
- Health
- Sport
Policy Questions @ Knowledge Graphs
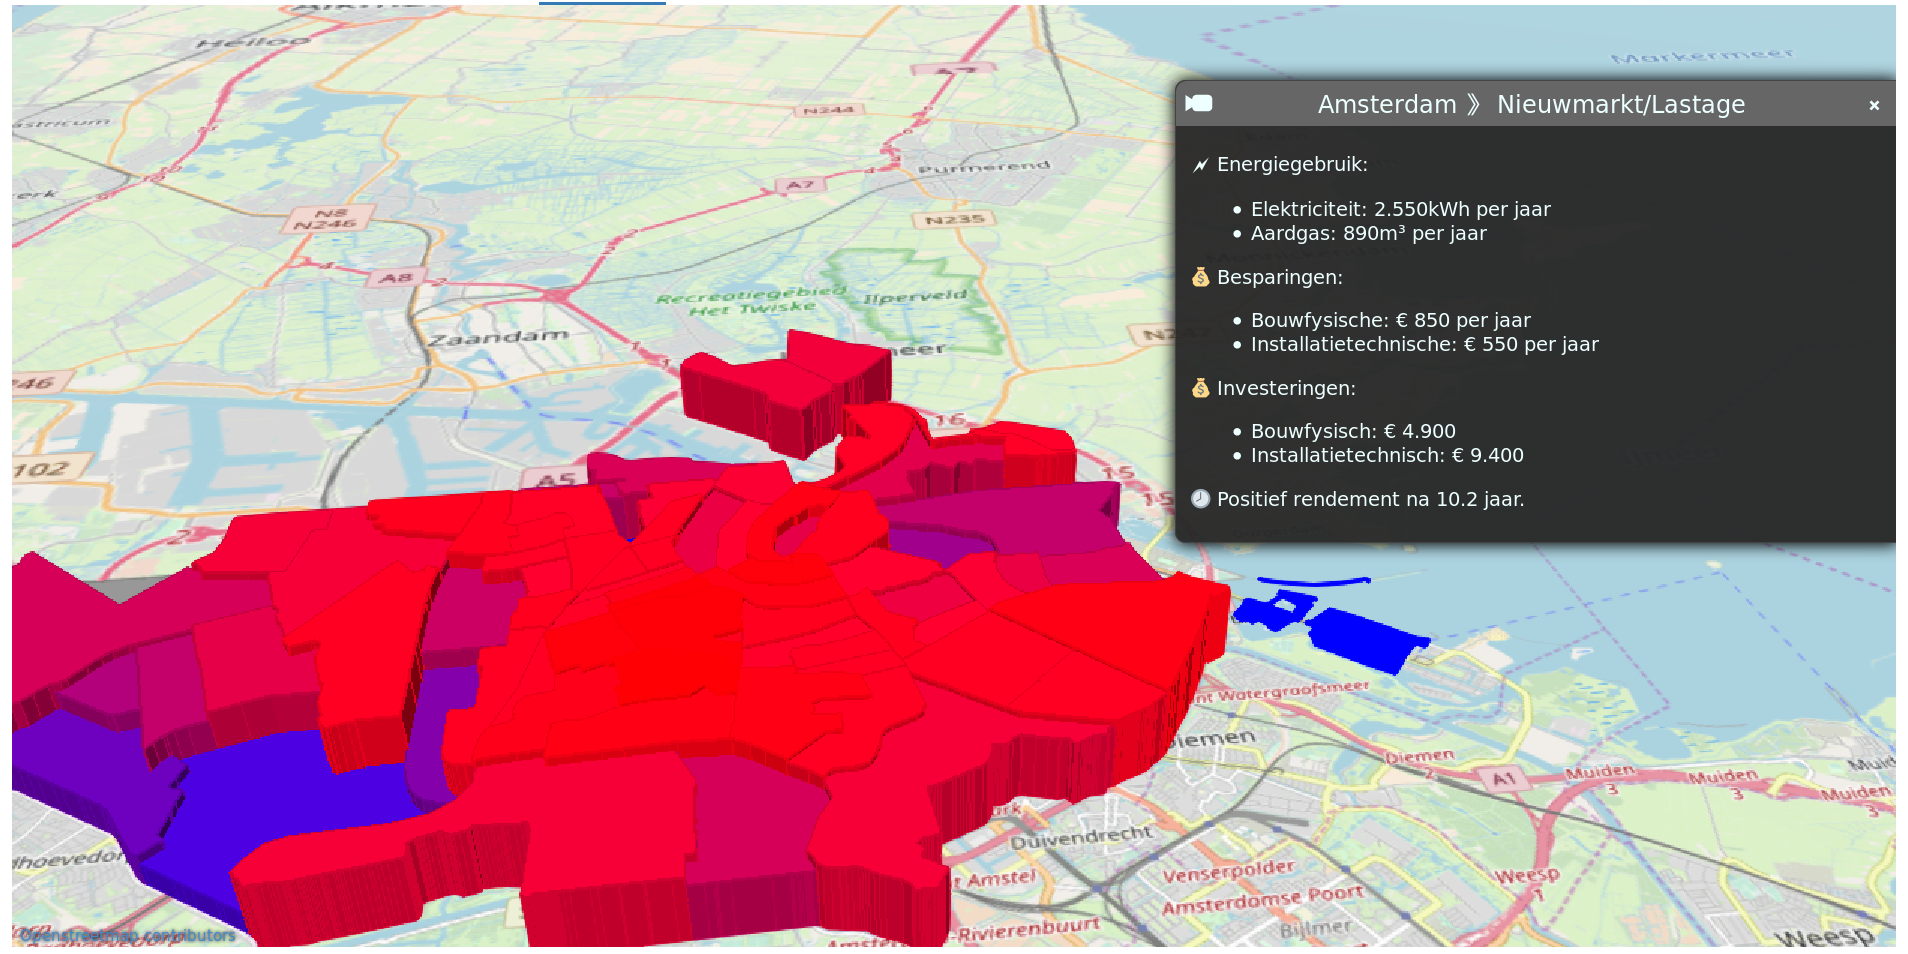
Real Estate Use Case
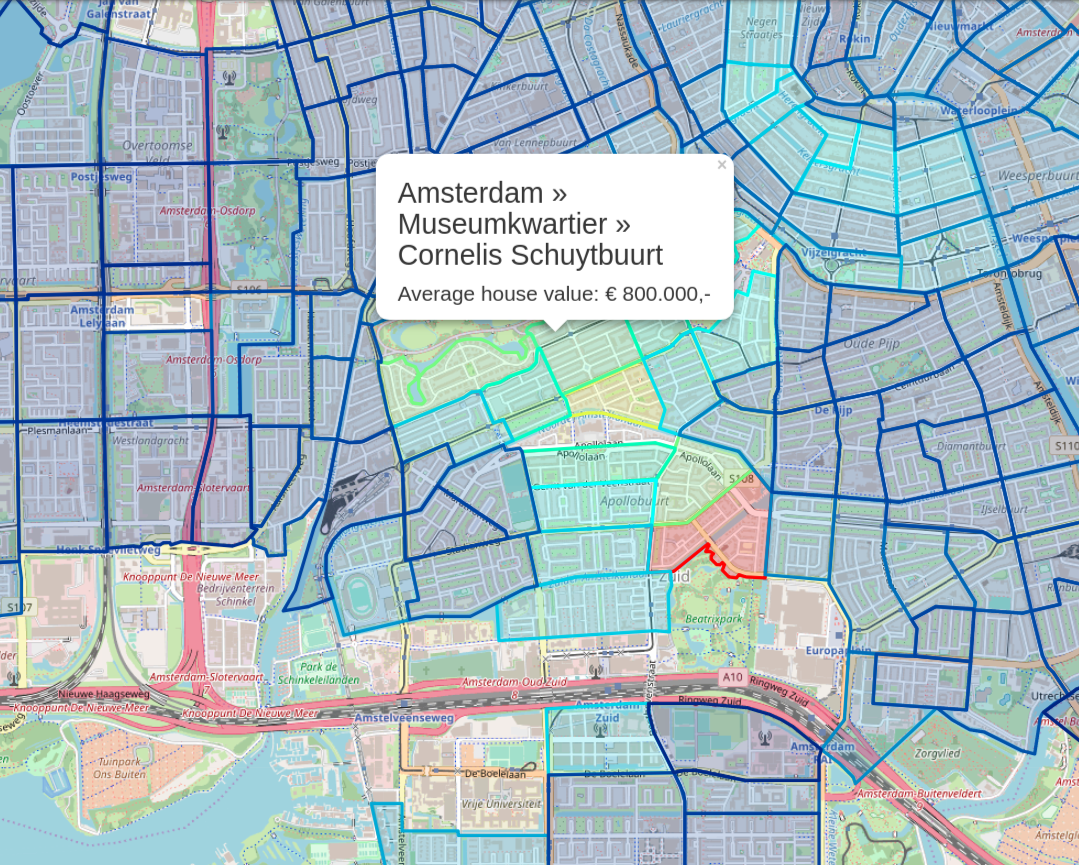
Neighborhood Score
Benefits of Knowledge Graphs
- Answer business questions across datasets
- Answer business questions across institutions
- Low-cost data integration
- 🠉 Create a Network Effect for your data
- Reach policy goals faster
- Provide better services to citizens
Thank you for your attention!
- WWW: triply.cc
- Email: w.g.j.beek@vu.nl
- Email: wouter@triply.cc
- Twitter:
@WGJBeek